Lancer Tactics Kickstarter Postmortem
Two weeks out from the Lancer Tactics campaign, we've been able to catch our breath a bit. Time for a postmortem on the campaign!
Overall Trends
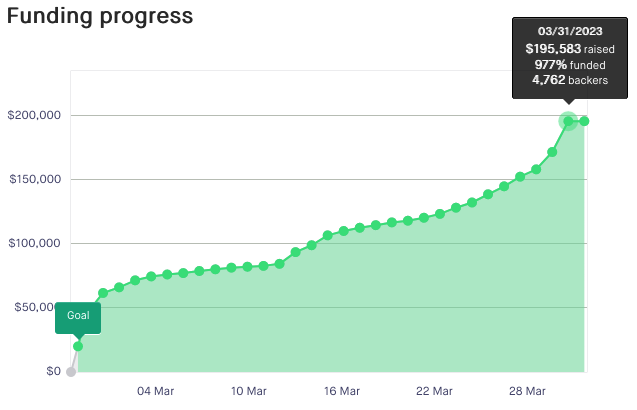
Figure 1. Overall funding progress for the entire campaign period.
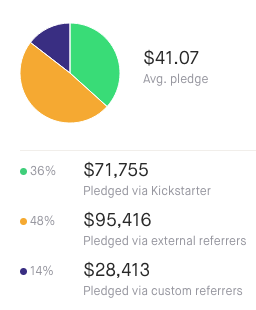
Let's collect some numbers! The project ran for 31 days, from March 1 to 31st, and raised a total of $195,585 from 4762 backers. There was $1905 in dropped pledges (1%) and a payment processing fee of $6753 (3.5%). The average pledge was $41.07; a week before the end of the campaign it was closer to $50, but the surge of $20 backers at the end brought it down.
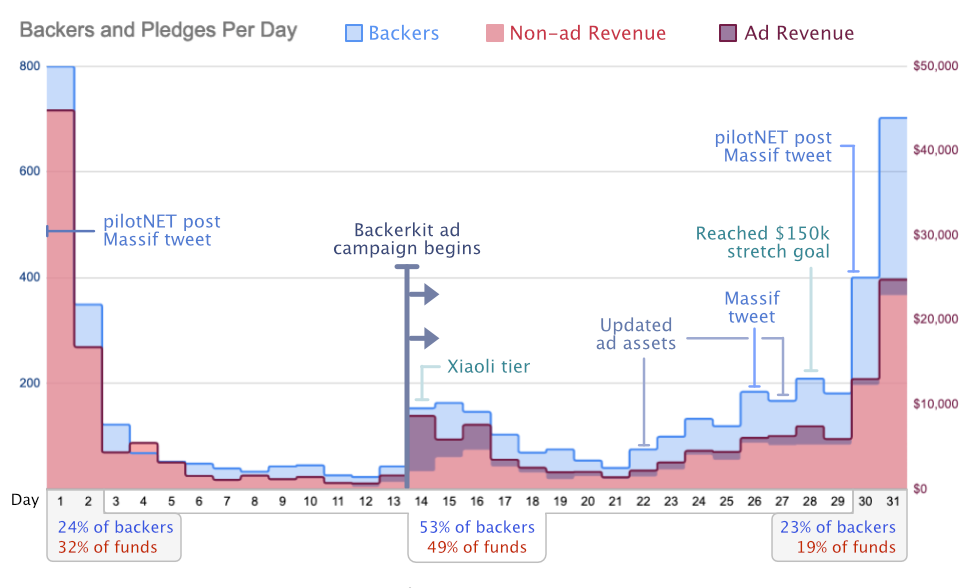
It followed the standard pattern of having a spike at the start and end of the campaign. The oft-quoted rule of thumb is about third of funding comes in during the first 48 hours, middle period, and the final 48 hours. However, we saw something closer to a 25–50–25% split.
Figure 2. Backers and funds per day. Both total funds and funds attributable to ads are shown overlayed. Notable events are annotated. It takes 1–2 days after updating ad assets for them to kick into gear, which is can been seen in the delay between the update and the bump of ad revenue a day later.
This weighting towards the middle plateau was is in large part due to starting the ad campaign midway through the campaign. I appreciate being able to clearly see its effects in the relative quiet of the middle period (more on that below).
I'm curious about what caused the gradual increase in daily revenue between the 22nd and 28th; I can anecdotally relate that as we closed in on the final $150k stretch goal, people got super excited about it and it felt like there was more grassroot sharing going on, but I don't know if that can explain such a sustained change. Edit: A backer pointed out that the record-breaking $6 million Battletech campaign launched on the 23rd, so it’s likely there was some Kickstarter bleed-over from that. Lucky!
In doing pre-launch research on other recent campaigns, I remember noticing that big end spikes actually seemed relatively rare; it was more common that there'd be a more-gradual 2-3x pickup in pledges the last week or so. I haven't heard this talked about or named, but it would be interesting to do a more comprehensive search and see if it's a real pattern and what the dynamics driving it might be. Something for next time.
An interesting note is that although the spike in backer count was comparable between the first and last 48 hours, the latter's funding spike was about 2/3 of the former. I would attribute this to the fact that the high-end rewards had all been claimed at that point, but it's also possible that late backers are more likely to pick lower tiers.
Rewards
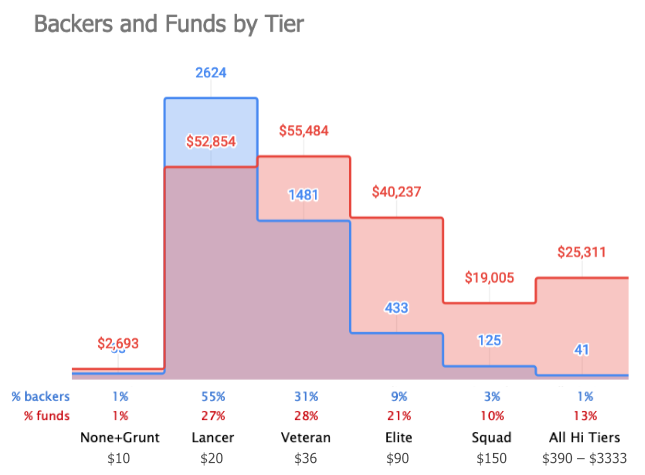
Figure 3. Backers and funds by tier. No reward selected + grunt are grouped together, as are Ultra, Spacer, Vehicle, LL12 Everest, and Xiaoli.
The $20 base Lancer tier for just the game was the most popular, as expected. However the Veteran tier actually raised slightly more funds despite being 2/3 as popular.
The lesson here for folks running their own campaigns: do not neglect your $100+ tiers! (although try hard to keep the cost of fulfilling them as low as possible!) There's a reason you see campaigns with a huge laundry list of deluxe xtreme VIP rewards; funds raised were about 50:50 between under and over that ~$100 slot. Weirdly, I saw that exact same pattern during my last campaign despite it having been an order of magnitude smaller.
Traffic sources
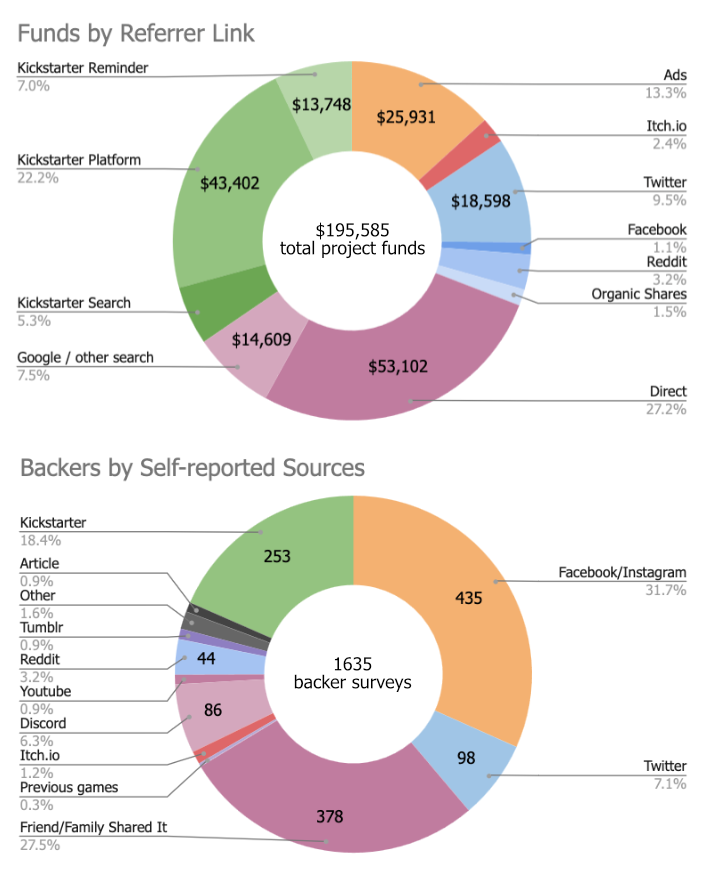
Figure 4. Funds by Referrer Link and Backers by Self-reported Sources. Kickstarter is broken up between sources where it pushed the link to the campaign (e.g. project discovery, related projects), reminders (i.e. where the backer asked to be notified on launch or the last 48 hours), and search (i.e. they searched "Lancer Tactics" on Kickstarter or a non-google page). Organic shares are links from misc websites, forums. Self-reported sources were gathered via a DM'd survey after a backer pledge.
I always wish I could see a timelapse of how these proportions change over the course of the campaign, but I only remembered to take a few scattered snapshots. Next time I'll try to do a daily download.
Once again, I neglected to utilize referral codes and have a big ol' slice of "Direct" links where we don't know where the person came from. I particularly wish I'd used them for the PilotNET Discord announcements; there are many grassroots servers that mirror that channel, and we have no way of measuring how many of those direct links are attributable to those. As those announcements went out at the start and in the last 48 hours, how much they drove those spikes is lost among the larger signal.
I'm always suspicious of the graph that Kickstarter provides for referrals (below) because it clumps the launch and final-48-hour reminder emails in with the traffic it drives itself through the site itself; how much of that is value coming from Kickstarter-the-platform vs how much of it could be replicated by sending those emails yourself?
By digging through the 100+ referral codes and grouping them into the above categories, we have an answer: of the "pledged via Kickstarter" reported here, about 20% is from reminder emails, 15% is from (specific?) searches for Lancer Tactics, and the remaining 65% is the direct value-add from Kickstarter pushing the campaign.
Supplemental figure. Referral chart from the Kickstarter dashboard.
Advertising
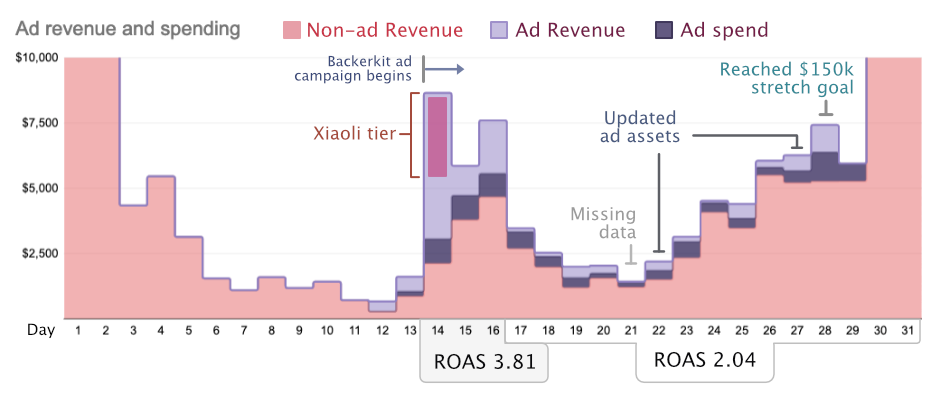
We ended up with an overall ROAS of 2.57; we spent $9679 (plus a $3735 commission to Backerkit) and trackably-raised $24,903 from 669 backers (about 13% of the total values); As described in the advertisement midmortem, that $24k revenue will chewed down to a "real" profit for the project of $8867. Roughly 2/3s of that profit came from the first three days of ads, including a one-off claiming of the Xiaoli tier, and the rest trickled in over the rest of the campaign.
Figure 5. Ad revenue and spending. A zoomed-in view of figure 2 with ad spend overlaid on top of ad revenue. The size of the Xiaoli tier shown on the day it was claimed. Lancer Tactic's break-even ROAS was about 1.79, so we were operating with a target ROAS of 2.30.
An extra $9k is, like, nice, but if that's all it was it would not have been worth the amount I've stressed out about this whole process. However, this is where that mysterious untracked increase in non-ad revenue comes in. How many more people backed the project via another route because they'd previously seen an ad? How many people didn't click the ad but went and searched for it elsewhere? How many people forwarded it to a friend who found it by some other means?
If we had started the ad campaign along with the start of the campaign it would have been impossible to separate it out from the rest of the signal (well, besides gratuitous referral tag usage), but we luckily accidentally performed the perfect experiment by starting it in the middle where there were no other major identifiable influxes of traffic. You can clearly see a big red hill build up along with the ad campaign (days 14-18) before returning to a resting pre-ad state (compare days 19–22 with days 6–11).
The best takeaway lesson I might hazard for this is "the ghost hill from advertisements will show up for the first few days, but don't depend on it to stick around." Perhaps calculate ROAS separately for the first few days and the steady long-burn; they seem to operate under different dynamics.
Finally, something I only learned/realized a week before the project was over is that the daily ROAS is not an independent variable; you have some amount of control to dial it up or down by how much money you put in! If your ROAS is super high, the professional wisdom is that you should turn your spending up because you haven't reached the edges of your audience yet. Increasing your adspend will make your ROAS eventually go down due to diminishing returns — but returns are returns.
(A reminder that the closer you get to your ROAS, the more it becomes an engine to funnel backer money into facebook's maw; so there are real ethical costs of chasing those pennies.)
For all you neuroscientists in the house, this means that the process is basically a voltage clamp! Adspend is injected current, ROAS is neuron membrane potential — whereas a current clamp would be having a budget of a flat X dollars every day.
In Conclusion
Another long one, thanks for reading! I feel like this was more of a statsdump than a careful dissection of the implications, but I've already spent too much time on this so this is what we got. Data for posterity, or something.
If I had to summarize what made this campaign take off more than any previous ones, I really have to say that the rocket fuel is due to working with an established IP and community. It’s such a different game to be able to say “hey! Lancer video game!” and have people get excited than having to do a cold-open pitch. I suspect that if you had identical pitch artifacts — the Kickstarter page, the playable demo — but it did not have the years of work that Massif has put into it + the corresponding community, it would have had to fight to hit 100%.
😇 This game a product of many people, and I hope to contribute to it as best as I can. 😇
😈 Give up on your own dreams! Work on other people’s games! 😈


